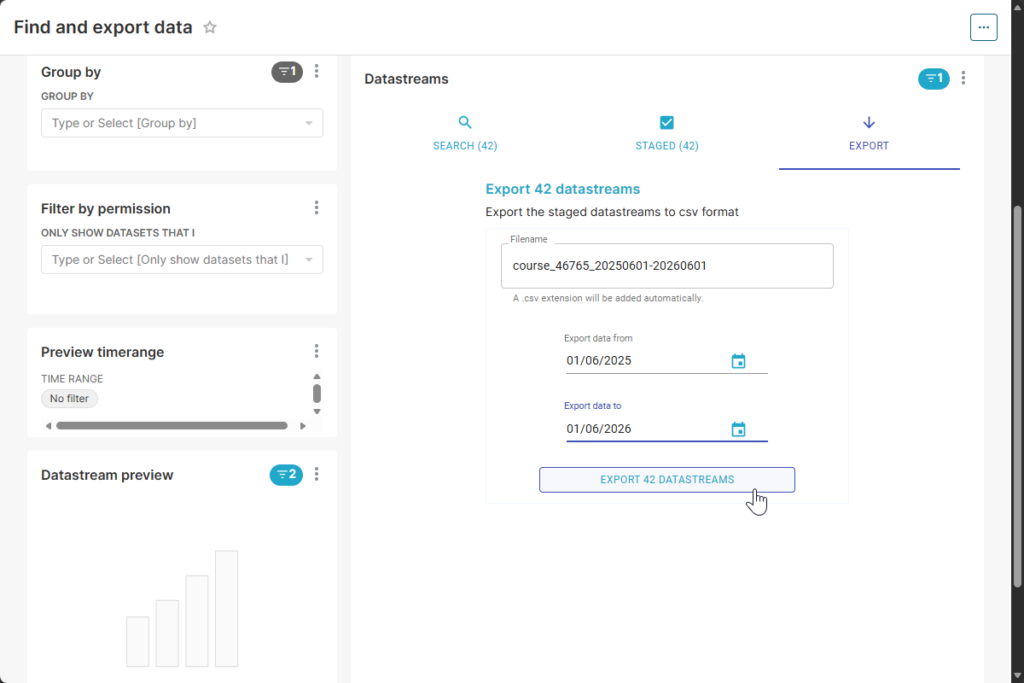
As a student at DTU you don’t have to create a new account, you can log into EnergyDataDK using your student credentials.
Ensure that you’ve selected the DTU login tab and enter your DTU student login credentials. You’ll also need to accept the Terms of Service and the Privacy Policy by checking the corresponding checkbox.
Press the LOG IN button to do just that.
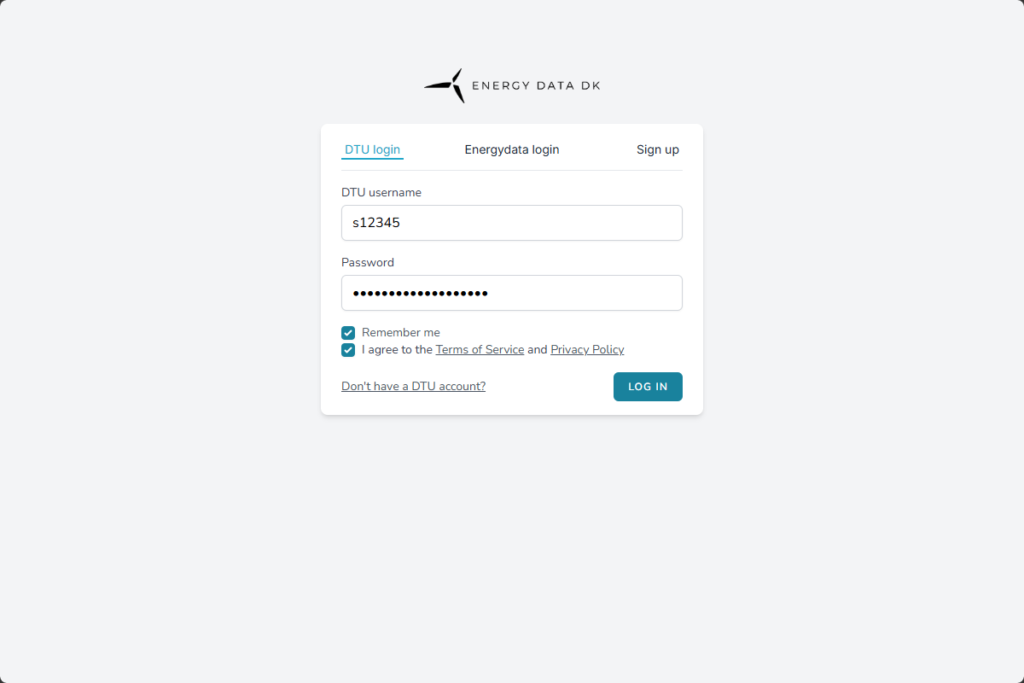
When you log in, you should see a screen with tiles representing datasets and a series of search fields.
In the main search field 1 enter “46765”, you should now see the tile representing the course dataset 2.
Click the tile. You will now be able to read all the relevant data in the lower left porting of your screen.
Here you may find information about the dataset; What data is included, the period the data covers, whether there are anomalies, and who to contact if there are questions about the dataset.
Click the magnifying glass icon 3 to proceed.
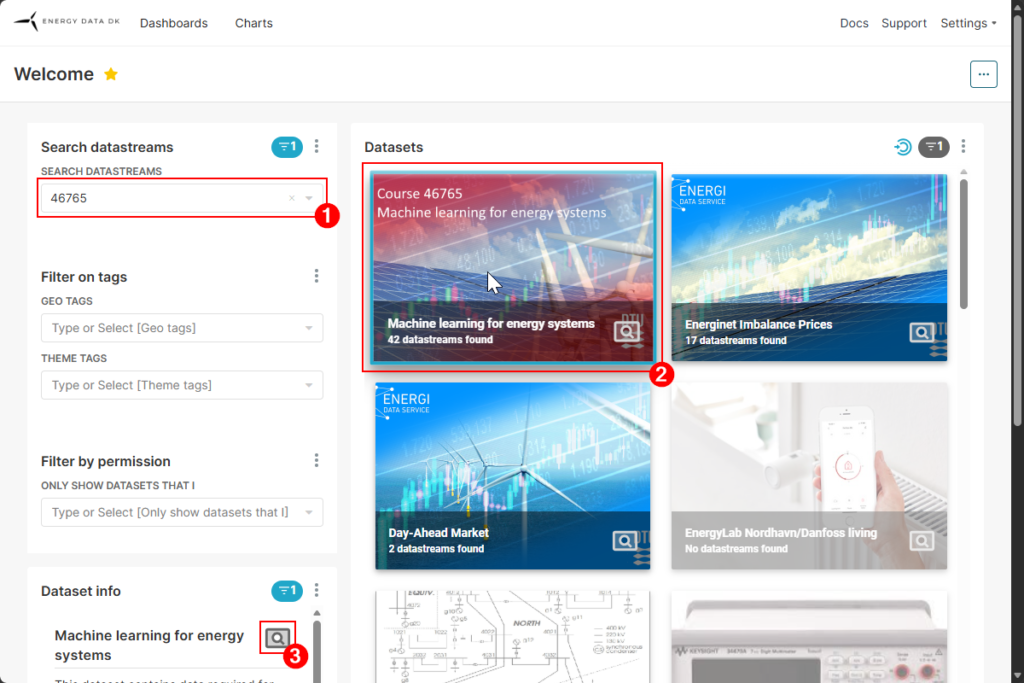
In this step we’ll download the meta data, this can be useful, but isn’t strictly required for the purposes of the course.
When you select a dataset you see an overview of the datastreams within the it. Click the icon 1, select Download 2, and choose Export to CSV 3.
A file should automatically be downloaded containing the meta data for all datastreams. This includes information like the unit of measurement, geo-coordinates, and other relevant information.
With your API key and the meta data file you can now generate graphs for all the datastreams in the course dataset, using our Graph generator.
You can find detailed instructions on its use on this website, on its documentation page.
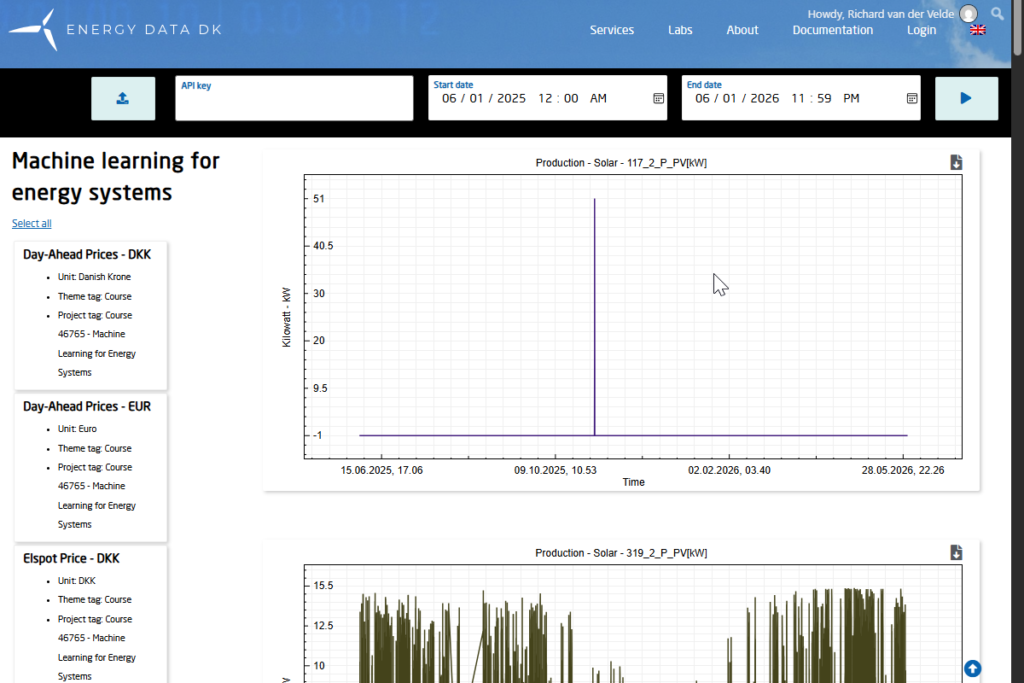
The least intact data is the production data, so be sure to select those.
You will likely see a smaller and a larger gap in each, which is described in the dataset description. You will probably also see the 2 of the PV panels and 1 of the wind turbines appear to have lower quality data.


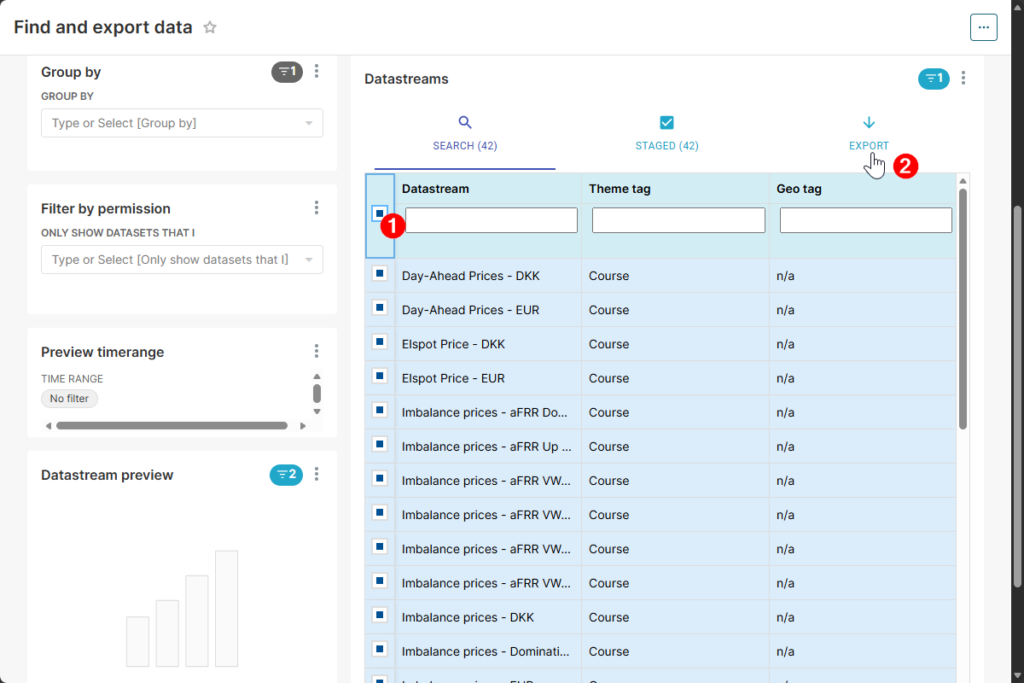
Once you’ve determined what data from the dataset is most useful to you, you can select the datastreams you want to download.
You can however also opt to download all the data and discard what you don’t need later.
Make your selection 1 and click the Export 2 button.
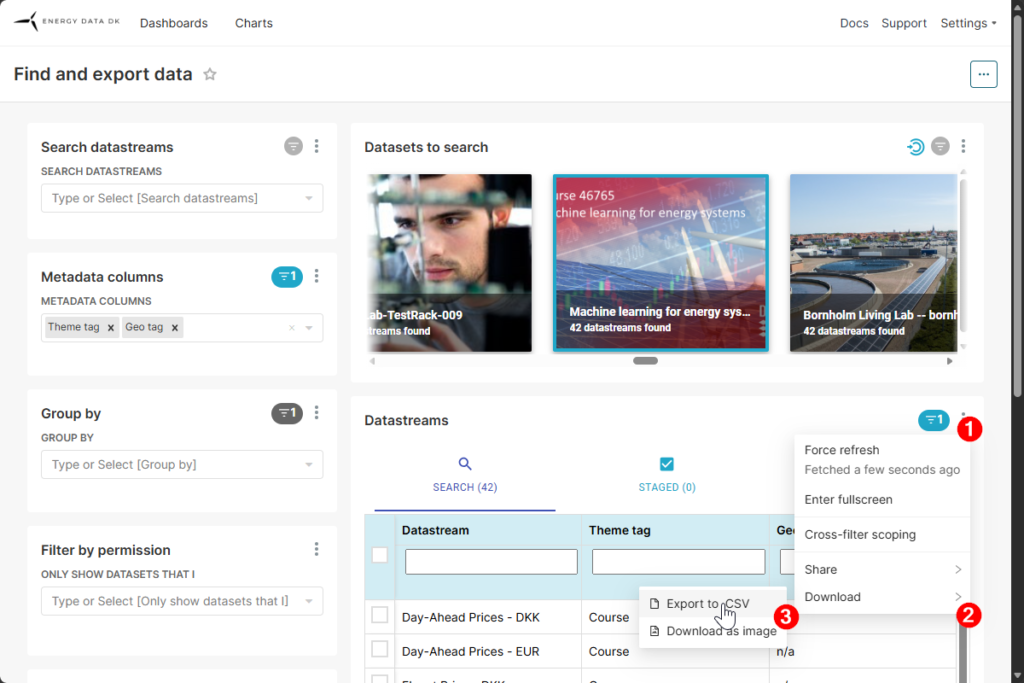
In the next screen, name your file, set the start and end dates to 01/06/2025 and 01/06/2026 respectively, and click the EXPORT 42 DATASTREAMS button.
You should receive an email with a download link momentarily. You can forward this email to your fellow students if they’re having trouble obtaining the data for themselves.