| Administrator (group) |
The administrator is a groupmember with full privileges, e.g., the administrator can add users to, or remove users from a group. They can additionally grant license to a dataset, thereby making it accessible to the group.
The administrator can only grant access to data sets that the administrator has ownership of. |
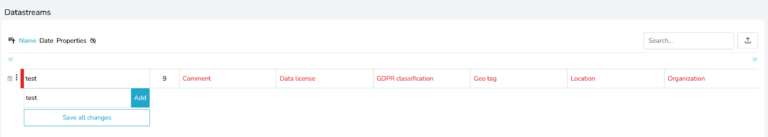
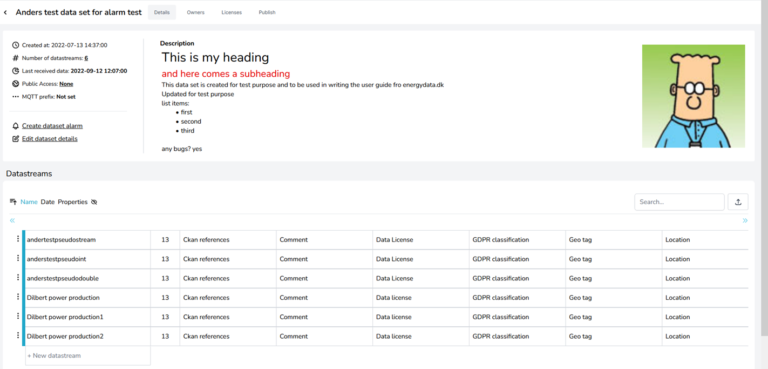
| Datastream |
Data is organized in EnergyDataDK in datasets and datastreams. A datastream is a source of data, for example from a sensor, a measurement device, or something similar.
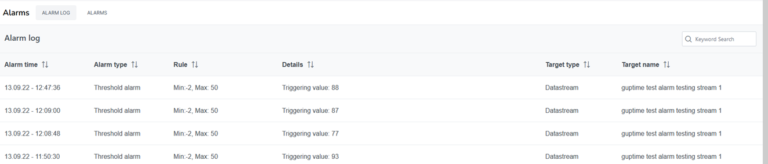
All observations from the source are a timestamp (when the measurement was performed) and the measurement itself, i.e., the “value”. All timestamps in EnergyDataDK are in UTC time.
A new observation with a duplicate timestamp will overwrite the existing observation.
Please note that the measurement device provides a timestamp for the measurement. Each data stream shall be described by a number of mandatory “tags” (meta data) in order the qualify the data. Additional non-mandatory tags may be added. |
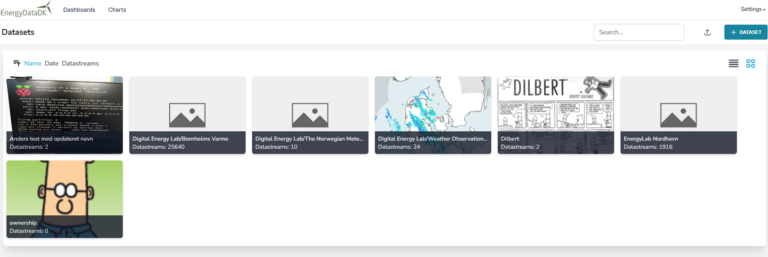
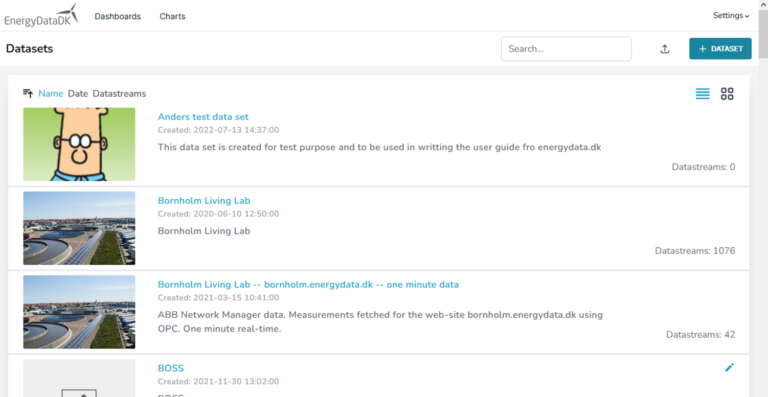
| Dataset |
A dataset is a collection of datastreams which are related in some way. The owner of the data can grant users access to a dataset, thereby granting access to all the datastreams within the dataset. |
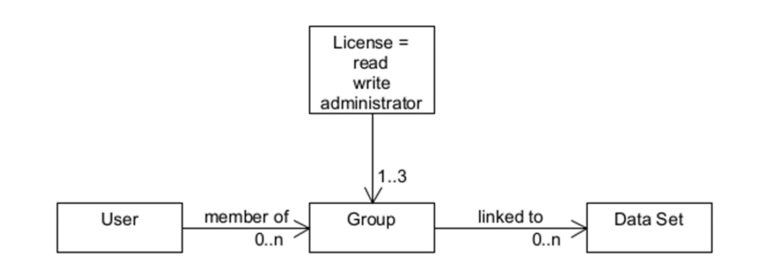
| Group |
A collection of users which share the same privileges, i.e., which datasets they can access and what privileges they have (read or write access).
Any user who owns (administrates) a dataset can create a group. |
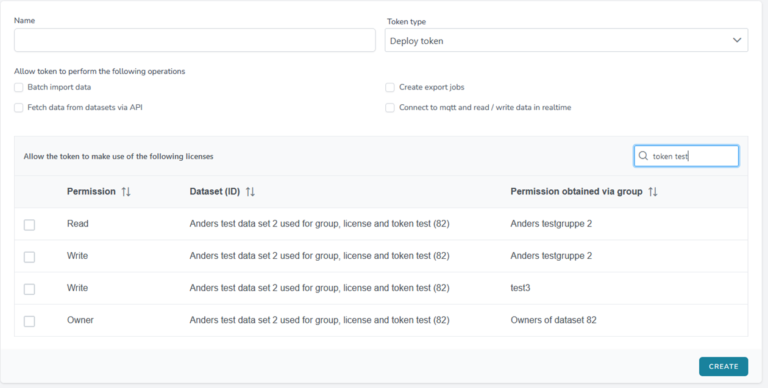
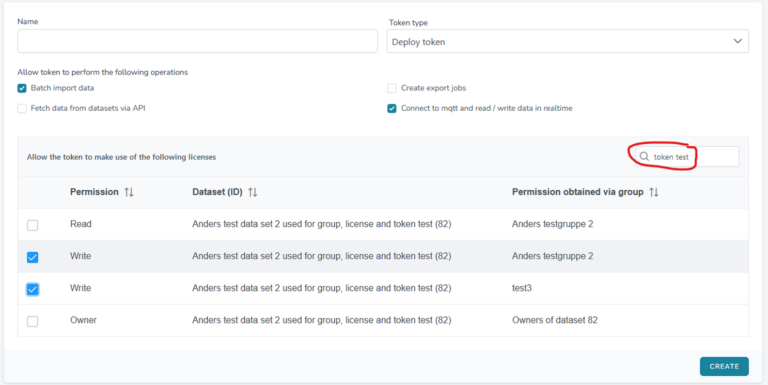
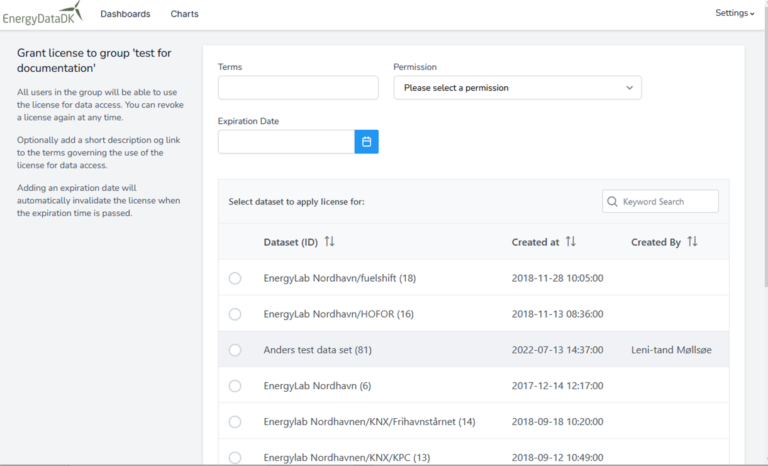
| License |
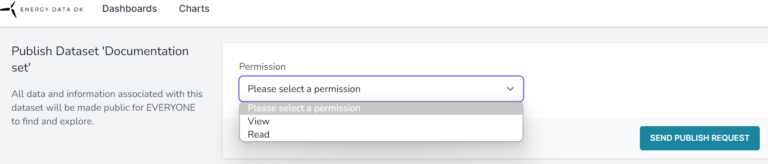
read or write access to a dataset is controlled by a license associated to the dataset for the group. |
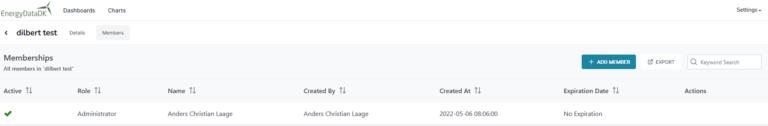
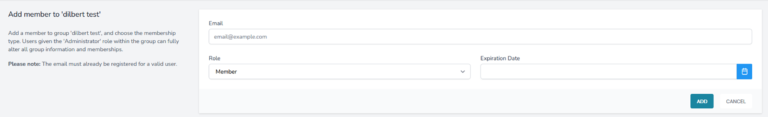
| Member (group) |
Membership of a group grants access to the datasets linked to the group |
| Owner |
The owner of a dataset has privileges to maintain the dataset and is usually the dataset's creator.
An owner can appoint additional owners. Appointed owners share identical privileges as the appointer. |
| Read |
A privilege which enables viewing a datastream in the preview window, exporting the data to a CSV file, or fetching the data via an API. |
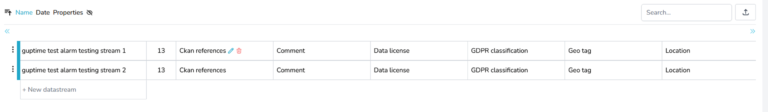
| Tag |
A metadata field for a datastream which describes or qualifies the datastream. |
| Topic |
A unique label for a datastream. The topic is used when inserting or requesting data for a data stream via an API. |
| Write |
A privilege which enables adding data to a datastream via an API |